Historical Pet Population data
Our pet population figures date back to 2011 and these tables provide a fascinating insight into how our habits have changed over time
Please note: whilst our figures date back over 14 years, the way we gather our data has evolved, with the annual survey moving from face-to-face to online following the 2020 Covid Pandemic. As a result, it is not possible to compare current data with data sourced prior to 2021.
UK Pet Food has chosen not to publish 2025 pet population data after results suggested a higher-than-expected dog population. The latest validated figures remain from 2026.
2024
In 2024, it is estimated that 17.2 million households (60%) own one of the UK's 36 million pets.
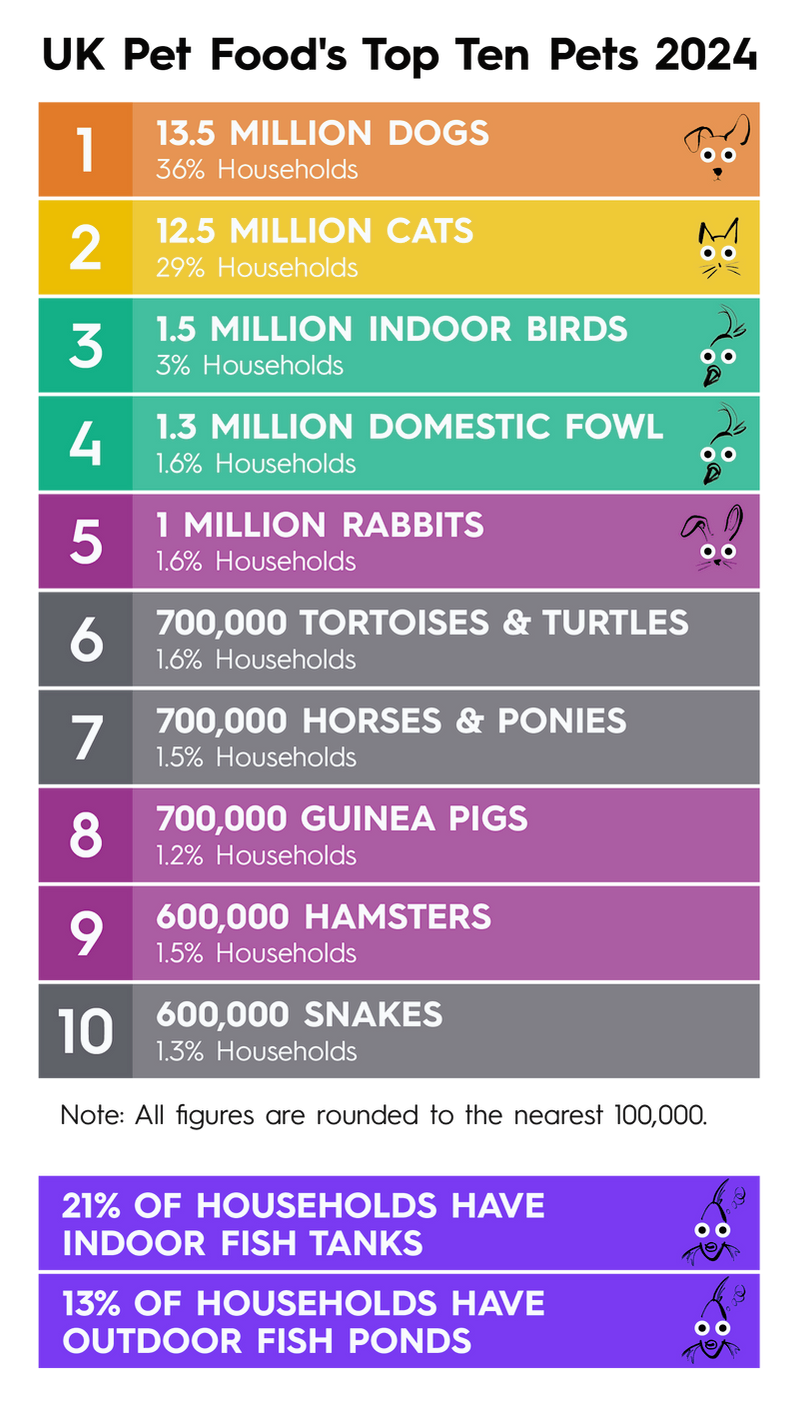
UK Pet Population 2024
Top 10 Pets
- Dogs: There are approximately 13.5 million dogs as pets in the UK, with 36% of households owning a dog.
- Cats: There are approximately 12.5 million pet cats in the UK, with 29% of all households having a cat.
- Indoor Birds: There are approximately 1.5 million birds kept as indoor pets in the UK, with 3% of households keeping them.
- Domestic Fowl: There are approximately 1.3 million domestic fowl as pets in the UK, with 1.6% of households having at least one.
- Rabbits: There are approximately 1 million rabbits as household pets in the UK, with 1.6% of households having at least one.
- Tortoises & Turtles: There are approximately 700,000 tortoises and turtles being kept as pets in the UK, with 1.6% of households having one.
- Horses & Ponies: There are approximately 700,000 horses as pets in the UK and 1.5% of households have one.
- Guinea Pigs: There are approximately 700,000 guinea pigs as pets in the UK, with 1.2% of households having at least one.
- Hamsters: There are approximately 600,000 hamsters as pets in the UK, with 1.5% of households having a pet lizard.
- Snakes There are approximately 600,000 pet snakes in the UK, with 1.3% of households having one.
Note: All figures are rounded to the nearest 100,000.
Pet Fish Population
- 21% of households have an indoor fish tank.
- 13% of households in the UK have an outdoor pond
Note: Kantar / Soulor Consulting online survey with 8,956 respondents, 2024
2023
Top 10 Pets in 2023:
Dogs: There were approximately 12 million dogs as pets in the UK, with 31% of households owning a dog.
Cats: There were approximately 11 million pet cats in the UK, with 26% of all households having a cat.
Rabbits: There were approximately 1.5 million rabbits as household pets in the UK, with 2.8% of households having at least one.
Indoor Birds: There were approximately 1.3 million birds kept as indoor pets in the UK, with 2.3% of households keeping them.
Guinea Pigs: There were approximately 1 million guinea pigs as pets in the UK, with 1.8% of households having at least one.
Domestic Fowl: There were approximately 1 million domestic fowls as pets in the UK, with 1.3% of households having at least one.
Hamsters: There were approximately 900,000 hamsters as pets in the UK and 2.1% of households have one.
Tortoises & Turtles: There were approximately 900,000 tortoises and turtles being kept as pets in the UK, with 1.8% of households having one.
Lizards: There were approximately 800,000 lizards as pets in the UK, with 1.8% of households having a pet lizard.
Snakes There arewereapproximately 700,000 pet snakes in the UK, with 1.4% of households having one.
Note: All figures were rounded to the nearest 100,000.
Pet fish population
- There were 7 million indoor fish tanks in the UK and 15% of households had one.
- 11% of households in the UK had an outdoor pond, making 6 million in total.
Note: Kantar / Soulor Consulting online survey with 8,901 respondents, 2023.
2022
In 2022 it was estimated that 17.4m (62% of) households had a pet.
| 2022 | Pet population (m) | % households with ..… |
|---|---|---|
| Dogs | 13 | 34% |
| Cats | 12 | 28% |
| Rabbits | 1 | 2.4% |
| Indoor Birds | 1.6 | 2.9% |
| Guinea Pigs | 0.9 | 1.3% |
| Domestic Fowl | 1.4 | 1.4% |
| Hamsters | 0.6 | 1.5% |
| Tortoises and Turtles | 0.6 | 1.4% |
| Snakes | 0.5 | 1% |
| Lizards | 0.4 | 1% |
| Horses and Ponies | 0.6 | 1.1% |
| Gerbils | 0.3 | 0.4% |
| Rats | 0.3 | 0.4% |
| Ferrets | 0.2 | 0.2% |
| Frogs and Toads | 0.4 | 0.5% |
| People keep insects | 0.1 | 0.3% |
| Newts/Salamanders | 0.2 | 0.3% |
| Pigeons | 0.7 | 0.9% |
| Mice | 0.1 | 0.2% |
2021
In 2021 it was estimated that 17m (59% of) households had pets.
|
2011-2020
These charts detail the rolling totals 2011-2020, when surveys were face-to-face.
| Rolling total | 2011-12 | 2012-13 | 2013-14 | 2014-15 | 2015-16 | 2016-17 | 2017-18 | 2018-19 | 2019-20 |
|---|---|---|---|---|---|---|---|---|---|
| Sample | 4,205 | 4,223 | 6,192 | 8,353 | 8,380 | 8,000 | 8,000 | 8,000 | 8,000 |
| % households | |||||||||
| Any pet | 47% | 48% | 47% | 46% | 40% | 44% | 45% | 40% | 41% |
| Indoor fish | 10% | 10% | 9% | 9% | 8% | 8% | 7% | 6% | 5% |
| Outdoor fish | 6% | 6% | 6% | 5% | 5% | 5% | 3% | ||
| Dogs | 22% | 24% | 25% | 24% | 24% | 24% | 26% | 25% | 23% |
| Cats | 18% | 19% | 18% | 17% | 17% | 17% | 18% | 17% | 16% |
| Rabbits | 3% | 3% | 3% | 2% | 2% | 2% | 2% | 1% | 1% |
| Domestic fowl | 1% | 1% | 1% | 1% | 0% | 1% | 0.4% | 0.4 | 0.3% |
| Guinea Pigs | 2% | 1% | 1% | 1% | 1% | 2% | 1% | 1% | 1% |
| Indoor birds | 2% | 2% | 2% | 1% | 2% | 0% | 1% | 1% | 1% |
| Hamsters | 2% | 2% | 1% | 1% | 1% | 1% | 1% | 1% | 0.5% |
| Lizards | 1% | 1% | 1% | 1% | 0.3% | - | 0.5% | 0.6% | 0.3 |
|
Pet population (m) |
2011-12 | 2012-13 | 2013-14 | 2014-15 | 2015-16 | 2016-17 | 2017-18 | 2018-19 | 2019-20 |
|---|---|---|---|---|---|---|---|---|---|
| All | 66.9 | 69.2 | 64.9 | 58.4 | 54 | 54 | 51 | ||
| Indoor fish | 23.0 | 23.3 | 23.3 | 19.9 | 16 | 15-20 | |||
| Outdoor fish | 21.8 | 21.8 | 18.4 | 17.1 | 20 | 15-20 | |||
| Dogs | 7.6 | 8.6 | 8.9 | 8.5 | 8.5 | 8.5 | 9 | 9 | 9 |
| Cats | 7.8 | 8.5 | 7.9 | 7.4 | 7.5 | 8 | 8 | 7.5 | 7.5 |
| Rabbits | 1.2 | 1.3 | 1.2 | 1.0 | 0.8 | 0.9 | 0.9 | 0.6 | 0.6 |
| Domestic fowl | 0.7 | 0.7 | 0.8 | 0.7 | 0.5 | 0.6 | 0.5 | 0.5 | 0.4 |
| Guinea Pigs | 0.9 | 0.6 | 0.5 | 0.7 | 0.7 | 0.5 | 0.4 | 0.4 | 0.4 |
| Indoor birds | 0.8 | 1.0 | 0.8 | 0.5 | 0.6 | 0.7 | 0.5 | 0.5 | 0.5 |
| Hamsters | 0.7 | 0.6 | 0.4 | 0.4 | 0.4 | 0.3 | 0.3 | 0.3 | 0.2 |
| Lizards | 0.3 | 0.4 | 0.4 | 0.3 | 0.3 | 0.5 | 0.2 | 0.3 | 0.2 |