
UK Pet Population

Every year, UK Pet Food commissions nationally representative research to estimate the UK's pet population. The research is independently conducted by Kantar with approximately 9,000 UK adults.
2026
Commissioned since 2010, our online pet population survey provides data on the number of UK households that own a pet and the Top Ten most popular pets.
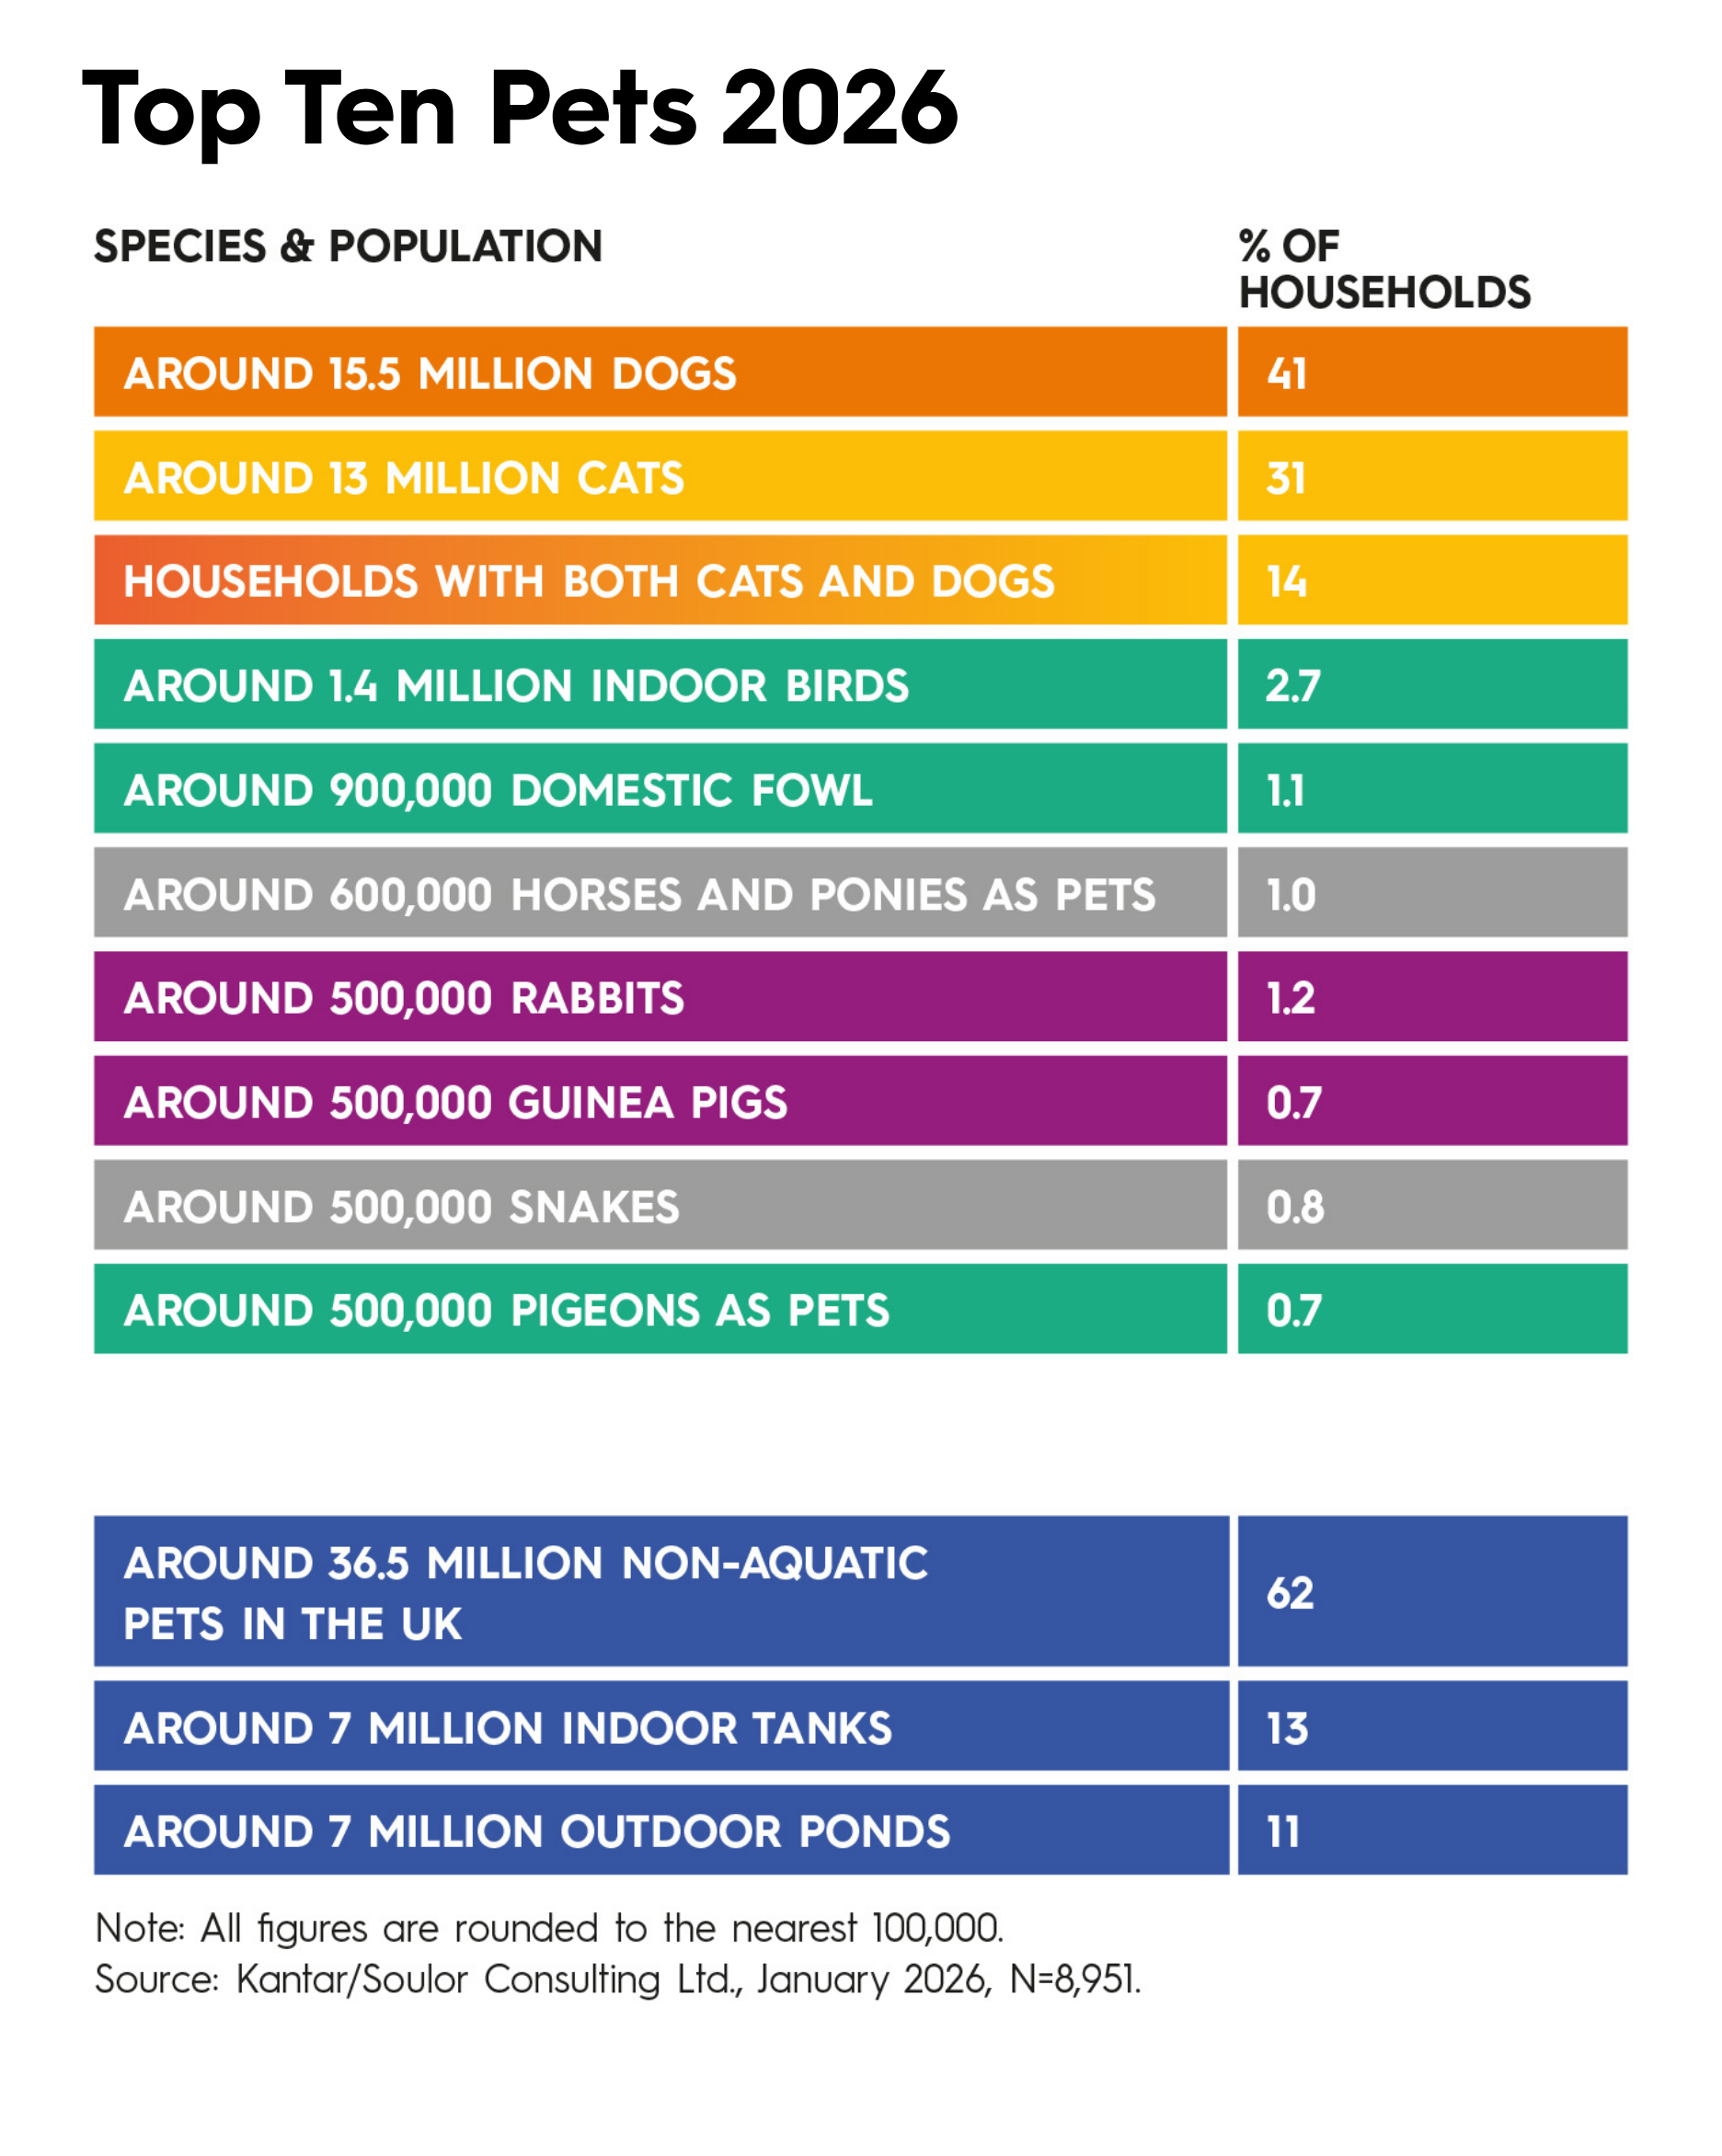
In 2026, it is estimated that 62% of households own one of the UK's 36.5 million pets.
Jump to our survey methodology
UK Pet Population 2026
Top 10 Pets

- Dogs: There are approximately 15.5 million dogs as pets in the UK, with 41% of households owning a dog.
- Cats: There are approximately 13 million pet cats in the UK, with 31% of all households having a cat.
- Indoor Birds: There are approximately 1.4 million birds kept as indoor pets in the UK, with 2.7% of households keeping them.
- Domestic Fowl: There are approximately 0.9 million domestic fowl as pets in the UK, with 1.1% of households having at least one.
- Horses & Ponies: There are approximately 600,000 horses as pets in the UK and 1% of households have one.
- Rabbits: There are approximately 500,000 rabbits as household pets in the UK, with 1.1% of households having at least one.
- Guinea Pigs: There are approximately 700,000 guinea pigs as pets in the UK, with 1.2% of households having at least one.
- Snakes: There are approximately 600,000 pet snakes in the UK, with 1.3% of households having one.
- Pigeons: The are approximately 500,000 pet pigeons in the UK, with 0.7% of households having one.
- Tortoises & Turtles: There are approximately 700,000 tortoises and turtles being kept as pets in the UK, with 1.6% of households having one.
Note: All figures are rounded to the nearest 100,000.
Pet Fish Population
- 13% of households have an indoor fish tank.
- 11% of households in the UK have an outdoor pond
Note: Kantar / Soulor Consulting online survey with 8,951 respondents, January 2026
Find out more about our survey methodology:
How is the UK Pet Population Survey carried out?
The UK pet population estimates are based on approximately 9,000 online interviews with UK adults, with fieldwork conducted each January.
Is the UK Pet Population Survey nationally representative?
Yes. The survey is designed to be nationally representative of the UK adult population, with the data weighted accordingly to reflect the UK population.
How accurate are the UK pet population figures?
For the main population survey, the estimated margin of error is ±1% at a 95% confidence level.
As with all survey-based research, UK pet population figures are estimates rather than exact counts.
How is the UK pet population calculated?
The pet populations are calculated for each species using a simple formula. The percentage of survey respondents claiming to own a particular pet species is multiplied by the total number of households in the UK (taken from the Office of National Statistics and a growth rate added to represent the same year as the pet data as ONS data can be slightly out of date); the sum of this is multiplied by the average number of that species per household to give a final estimate of that species population. The result is then rounded to provide the final published estimate.
Can UK pet population figures be compared over time?
Some caution is needed when comparing UK pet population figures over time.
The survey moved from face-to-face interviewing to online research in 2021, following the Covid-19 pandemic. Online surveys tend to produce somewhat higher estimates of pet ownership than the previous face-to-face approach. Figures from 2021 onwards should therefore not be directly compared with figures collected before 2021.
From 2022, the survey sample size was increased to approximately 9,000 respondents, allowing robust population estimates to be reported annually without averaging results across multiple years. Comparisons with earlier years should therefore be interpreted with care.
How are UK pet population figures reported?
Pet population figures are estimates and are rounded to the nearest 100,000.